Google Analytics Reader
The Google Analytics Reader node fetches GA4 report data such as sessions, users, page views, conversions, and revenue for any date range.
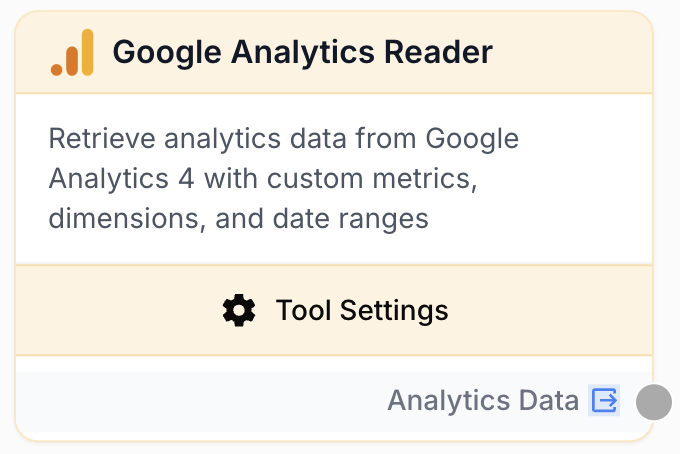
What does the Google Analytics node do?
The Google Analytics Reader node connects to Google Analytics 4 and pulls report data on demand. You pick an account and a property, choose metrics and dimensions from a curated GA4 list, set a date range, and the node returns the rows as a JSON string ready to be processed by downstream nodes.
What’s New: Add dimension filters, use dynamic date expressions such as {{system.dateNow - 7 days}}, and compare the current range with the previous period, previous year, or a custom period. Enabling a comparison changes the output from a flat array to an object with current and comparison sections.
Common use cases:
- Building automated weekly or monthly traffic reports without logging into GA4.
- Tracking conversion funnels by combining event metrics (
conversions,eventCount) with traffic source dimensions. - Comparing year-over-year performance for a specific property and pushing the result into an LLM for narrative commentary.
- Running multi-property batch reports — feed properties from a list and let one node iterate.
Quick setup
Connect a Google Analytics integration
In Builder > Integrations > Google, authenticate with the Google account that owns access to your GA4 properties. The same integration is reused by every Google Analytics Reader node in the workspace.
Add the node to the canvas
Open the Node Library, go to Integrations > Google > Analytics, and drop the Google Analytics Reader node onto your workflow.
Pick account, property, metrics, and dimensions
In the node settings, select the Account and Property from the autocomplete dropdowns (populated from your integration). Choose one or more Metrics (e.g. sessions, activeUsers) and optional Dimensions (e.g. date, country).
Configure the date range
Pick a predefined Date Range (Last 7/28/30/90 days, This month, Last year, etc.) or choose Custom Date Range and fill in start_date and end_date in YYYY-MM-DD format.
Connect the output
Wire the node’s output to the next step — an LLM, a JSON Path Extractor, or a Google Sheets Writer. Define the receiving variable name on that next node to access the analytics JSON.
Configuration parameters
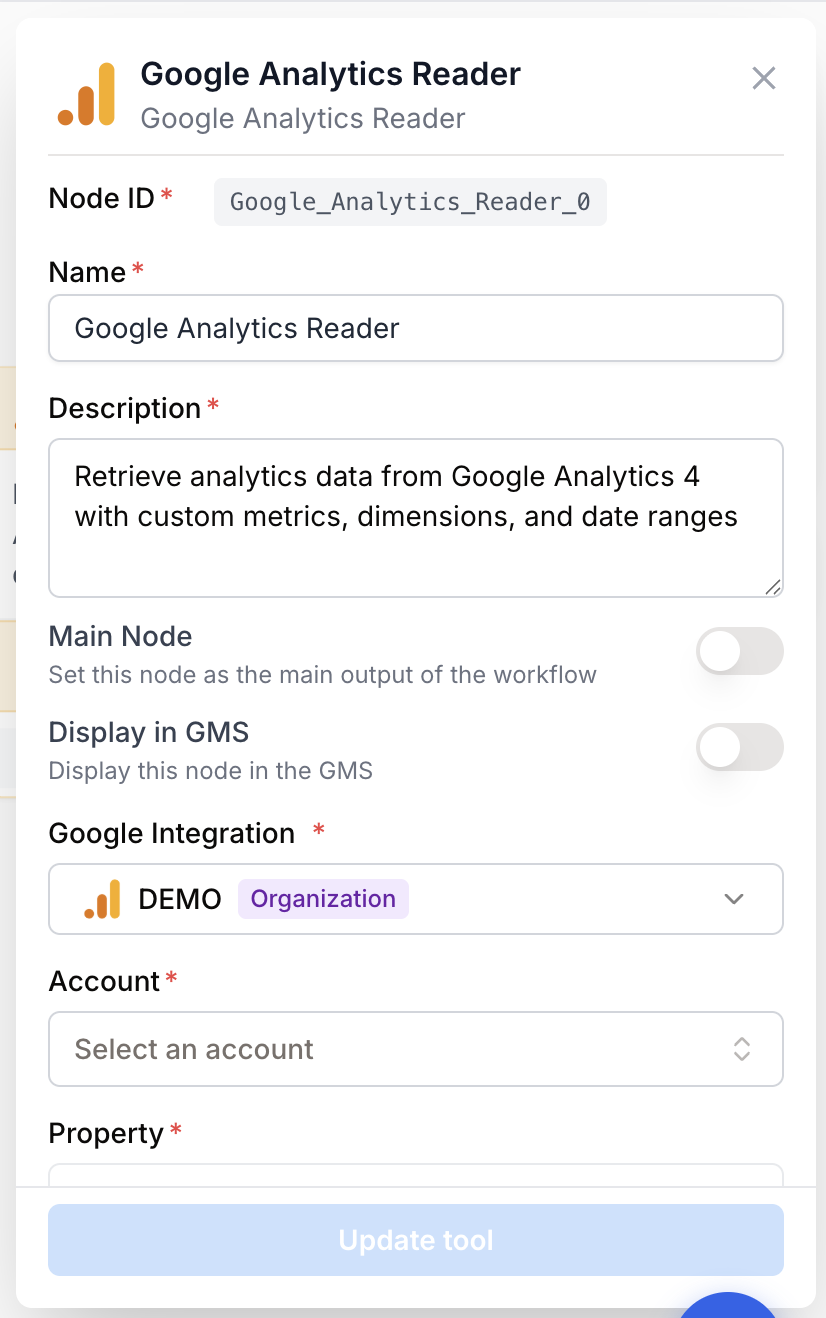
Required fields
integration_id integration required Google Analytics integration — The OAuth connection used to query the GA4 Data API. Selected inline by default; can be externalized via the Use Integration Variable toggle so an upstream node feeds it at runtime.
account_id string required GA Account — The GA account that owns the property (e.g. accounts/123456). Picked from the autocomplete dropdown after the integration is connected.
property_id string required GA4 Property — The GA4 property to query (e.g. properties/456789). The dropdown is filtered to properties belonging to the selected account.
metrics string required default: sessions,activeUsers Metrics — Comma-separated list of GA4 metric names. Available metrics include user metrics (activeUsers, newUsers, totalUsers), session metrics (sessions, engagedSessions, averageSessionDuration), engagement (engagementRate, bounceRate), page views (screenPageViews), events (eventCount, conversions), and e-commerce (totalRevenue, ecommercePurchases, transactions, purchaseRevenue).
date_range_type string required default: last_28_days Date Range — Predefined range or custom. Allowed values: today, yesterday, last_7_days, last_28_days, last_30_days, last_90_days, last_12_months, this_month, last_month, this_year, last_year, personalized. Choose personalized to provide explicit start_date and end_date.
Optional fields
dimensions string Dimensions — Comma-separated list of GA4 dimension names. Common values: time (date, month, dayOfWeek, hour), geography (country, city, region), device (deviceCategory, browser, operatingSystem), pages (pagePath, pageTitle, landingPage), traffic source (sessionSource, sessionMedium, sessionCampaignName, sessionDefaultChannelGroup), and events (eventName).
start_date string Start date — Used only when date_range_type is personalized. Accepts YYYY-MM-DD, {{system.dateNow}}, {{system.dateNow - N days}}, or the externalized {{startDate}} variable.
end_date string End date — Used only when date_range_type is personalized. Accepts YYYY-MM-DD, {{system.dateNow}}, {{system.dateNow - N days}}, or the externalized {{endDate}} variable.
dimension_filters array Dimension filters — Optional GA4 dimension rules. Values inside one rule are combined with OR; multiple rules are combined with AND. Each rule selects a dimension, an operator (equals, contains, starts_with, or regex), and one or more values.
comparison_preset string default: none Period comparison — none, previous_period, previous_year, or custom. A comparison runs the same metrics, dimensions, and filters over a second date range.
comparison_start_date string Comparison start date — Start of the computed or custom comparison range. For custom, accepts the same ISO dates and dynamic date expressions as start_date.
comparison_end_date string Comparison end date — End of the computed or custom comparison range. For custom, accepts the same ISO dates and dynamic date expressions as end_date.
row_limit number default: 10000 Row limit — Maximum number of rows returned by the GA4 Data API (1 to 100,000). Lower this for high-cardinality dimensions to keep payloads manageable.
use_variables boolean default: false Use Variables — When enabled, both account ID and property ID are exposed as input handles and fed by upstream nodes (typically a Google Analytics Property input). The toggle is atomic — mixing a static account with a variable property would risk picking a property the static account does not own.
use_integration_variable boolean default: false Use Integration Variable — Exposes the integration as an input handle. Enabling this forces use_variables to ON, since without a concrete integration the settings panel cannot load accounts and properties.
For batch runs over many properties, wire a Google Analytics Property input node into the Reader’s account_id, property_id, and integration_id handles. One workflow run, N reports.
What does the node output?
Without a comparison, the node outputs a JSON string containing a flat array of GA4 rows. Each row mixes the selected dimensions and metrics in one object.
Example without comparison:
[
  {
    "date": "20260115",
    "country": "France",
    "sessions": 1500,
    "activeUsers": 1200
  }
]Conditional output shape: when comparison_preset is not none, the flat array is replaced by {"current": {"start_date", "end_date", "data"}, "comparison": {"start_date", "end_date", "data"}}. Update downstream JSON paths to read current.data and comparison.data.
analytics_data string A JSON string containing either a flat array of GA4 rows or, when comparison is enabled, an object with current and comparison report sections.
Usage examples
Example 1: Weekly traffic report into Google Sheets
You want an automated weekly snapshot of sessions and active users by country, written to a shared Google Sheet.
Configuration:
- Account / Property: picked inline.
- Metrics:
sessions,activeUsers,engagementRate - Dimensions:
date,country - Date Range:
last_7_days - Row limit:
10000
Connect the output to a Google Sheets Writer node and append the rows to a Weekly Traffic tab.
Example 2: Multi-property batch report
You manage 30 GA4 properties for different clients and want one report per property, on demand.
Configuration:
- Add a Google Analytics Property input node, in batch mode, fed from a CSV listing all 30 properties.
- On the Reader, enable Use Integration Variable (which auto-enables Use Variables).
- Wire
integration_id,account_id, andproperty_idfrom the input node to the Reader. - Metrics:
sessions,totalRevenue,conversions - Dimensions:
sessionDefaultChannelGroup - Date Range:
last_28_days
Each row of the CSV triggers one Reader call; pipe the output into an LLM to generate a per-client narrative.
Example 3: Year-over-year comparison
Compare this March against last March for one property.
Configuration:
- Date Range:
personalized - Start date:
2026-03-01, End date:2026-03-31 - Metrics:
sessions,totalUsers,totalRevenue - Period comparison:
previous_year
The node returns both periods in current.data and comparison.data. Pass those sections to an LLM or extract the values with the matching downstream JSON paths.
Common issues
The Account or Property dropdown is empty
Cause: The Google account behind the integration does not have access to any GA4 properties, or the integration was just created and the property cache has not refreshed.
Solution: In Google Analytics, confirm the account has the Viewer role at minimum on the target property. Then reopen the node settings — autocomplete is fetched live from the GA Admin API on focus.
The node returns no rows even though the property has traffic
Cause: The selected date range falls outside the property’s data retention window, or the metric/dimension combination is invalid for GA4 (some pairs are not allowed by the Data API).
Solution: First widen the date range to last_28_days and remove all dimensions to confirm the property responds. Then re-add dimensions one by one — the GA4 Data API rejects some combinations (for example, certain user-scoped metrics with event-scoped dimensions).
Custom date range error: invalid format
Cause: start_date or end_date is not in YYYY-MM-DD format, or end_date is earlier than start_date.
Solution: Use ISO date strings such as 2026-03-01. When feeding dates from upstream nodes, format them upstream rather than relying on locale defaults.
Authorization or permission error from GA4
Cause: The OAuth token behind the integration was revoked, expired, or the user no longer has access to the property.
Solution: Open Settings > Integrations, locate the Google Analytics integration, and reconnect it. If the underlying Google account lost property access, regrant the Viewer role in GA4 Admin.
Mixing static account with variable property is blocked
Cause: The Use Variables toggle is atomic — both account and property switch together. The runner would otherwise let an upstream property override the static account, leading to mismatched account/property pairs.
Solution: Either keep both account and property static, or enable Use Variables and feed both from upstream input handles.
Best practices and pitfalls
Keep row_limit aligned with the cardinality of your dimensions. With pagePath on a high-traffic site, even 28 days easily exceeds 10,000 rows — bump the limit or tighten the date window.
Pair this node with a Google Analytics Property input whenever you want a workflow that runs across multiple properties without duplicating nodes. Externalize once, reuse forever.
Watch dimension/metric compatibility. GA4 rejects some combinations (e.g. session-scoped metrics with user-scoped dimensions). When troubleshooting, strip dimensions back to date and add them back one at a time.
Date format matters. GA returns date dimension values as YYYYMMDD (no separators), while custom range inputs use YYYY-MM-DD. If you parse the output downstream, account for the difference.
How does it fit into a workflow?
Google Analytics Reader is typically a data-source node placed near the start of a workflow, feeding either a transformation step or a writer.
graph LR
    Trigger[Schedule trigger] --> GA[Google Analytics Reader]
    GA --> Extract[JSON Path Extractor]
    Extract --> LLM[LLM commentary]
    LLM --> Sheets[Google Sheets Writer]
Related nodes
Runtime selector for the GA4 account, property, and integration to feed this node — essential for multi-property batch runs.
Pull specific fields out of the analytics JSON before passing them to an LLM or a writer.
Turn raw GA4 numbers into a narrative commentary, a summary email, or a slide deck blurb.
Pair organic search performance with GA4 engagement metrics for a complete SEO picture.