Running & Testing Workflows
Execute, debug, and monitor your workflows
Overview
Once you’ve built a workflow, it’s time to run it. This guide covers everything from manual testing to monitoring production executions.
Running a workflow
Manual execution
The quickest way to test your workflow:
- Click the App button in the top-right corner
- A panel opens showing your workflow’s input form
- Fill in any required inputs
- Click Generate
Execution modes
| Mode | Description | Use case |
|---|---|---|
| Run once | Execute a single time | Testing, one-off tasks |
| Run with inputs | Provide custom inputs | Processing specific data |
| Scheduled | Run automatically | Regular reports, monitoring |
Monitoring execution
Real-time progress
While your workflow runs, you can see:
- Current node: Which node is executing
- Progress: How many nodes completed
- Duration: Time elapsed
- Status: Running, completed, or failed
Node status indicators
| Color | Status |
|---|---|
| 🔵 Blue | Currently executing |
| 🟢 Green | Completed successfully |
| 🔴 Red | Failed with error |
| ⚪ Grey | Not yet executed |
Viewing outputs
Click on any completed node to see:
- Output data: The actual result
- Execution time: How long it took
- Logs: Detailed execution logs
Debugging workflows
Common issues
Node shows 'undefined' output
Cause: The previous node didn’t return expected data.
Solution:
- Check the previous node’s output
- Verify your variable path is correct
- Add a Conditional node to handle missing data
API node returns error
Cause: External service issue or invalid configuration.
Solution:
- Check your API credentials
- Verify the endpoint URL
- Test the API directly with curl or Postman
- Check rate limits
Loop never completes
Cause: Too many items or infinite loop condition.
Solution:
- Add a maximum iteration limit
- Check your loop exit condition
- Process data in batches
Workflow times out
Cause: Processing takes too long.
Solution:
- Increase timeout in workflow settings
- Optimize slow nodes
- Run heavy operations in parallel
Using run history
Access the complete history of all workflow executions:
- Open your workflow
- Click on the Run History tab
- View all past executions with their status, duration, and outputs
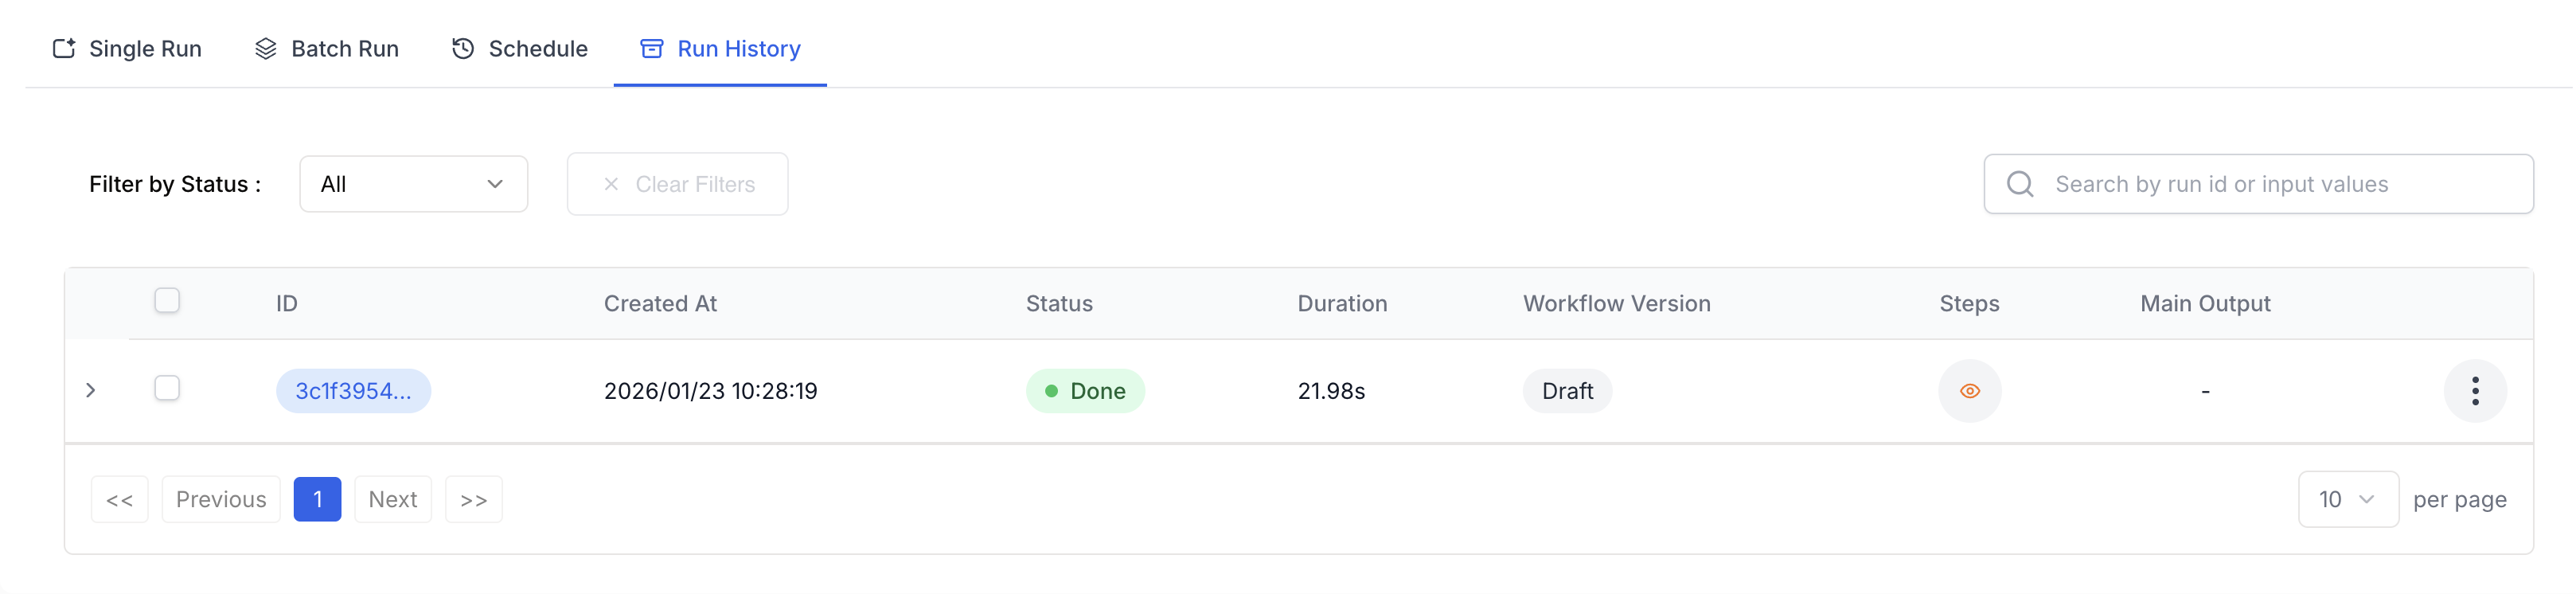
The run history table displays:
- ID: Unique identifier for each run
- Created At: Date and time of execution
- Status: Done, Failed, or Running
- Duration: Total execution time
- Workflow Version: Draft or Published version used
- Steps: Click the eye icon to view detailed step information
- Main Output: Quick access to the final result
Viewing step details
Click the Steps icon (👁) on any run to see a detailed breakdown of each node’s execution:
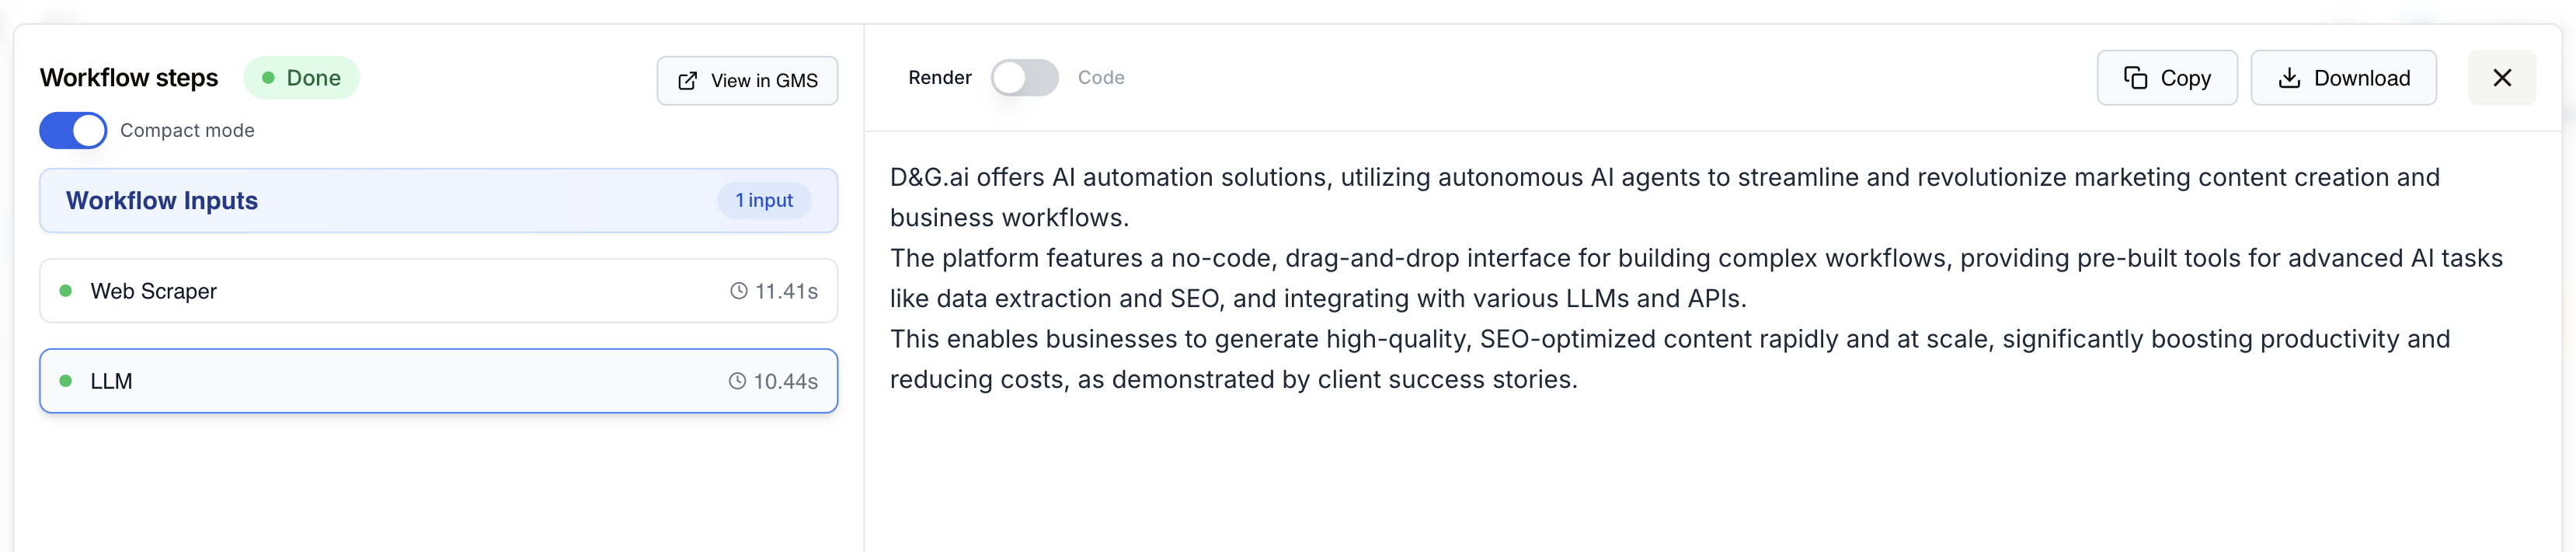
The step details panel shows:
- Workflow steps: List of all executed nodes with status indicators
- Execution time: Duration for each individual node
- Compact mode: Toggle to show/hide details
- Render/Code view: Switch between formatted output and raw data
- Copy/Download: Export the output data
Use Compact mode to quickly scan through all steps, then click on a specific step to expand its details.
Step-by-step debugging
For complex issues:
- Isolate the problem: Disable nodes after the failing one
- Check inputs: Verify the failing node receives correct data
- Test manually: Run the operation outside Draft & Goal
- Review connections: Ensure data flows correctly
- Compare runs: Use history to compare successful vs failed executions
Debugging AI Agents
AI Agent nodes require special debugging because they make autonomous decisions. Draft & Goal provides a dedicated Agent Trace feature to understand exactly what your agent did.
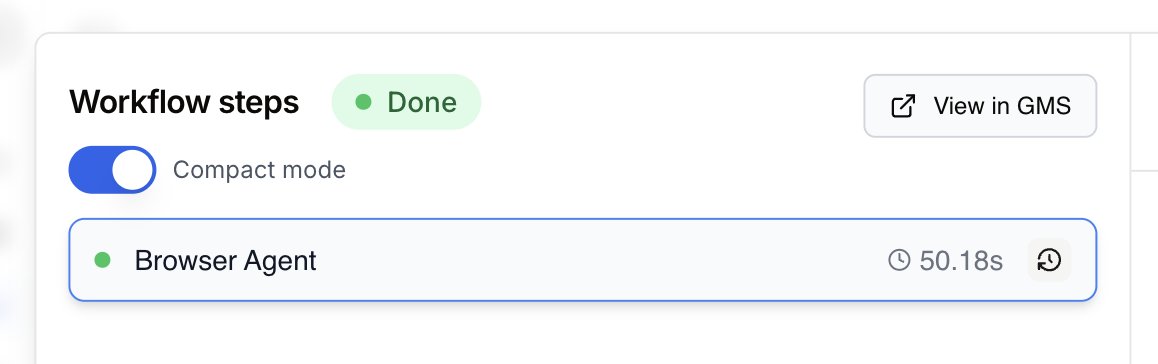
Accessing Agent Traces
When viewing workflow steps, AI Agent nodes display a clock icon (🕐) next to their execution time. Click this icon to open the trace viewer:
Understanding Agent Traces
The Agent Trace panel shows the complete conversation between the AI and its tools:
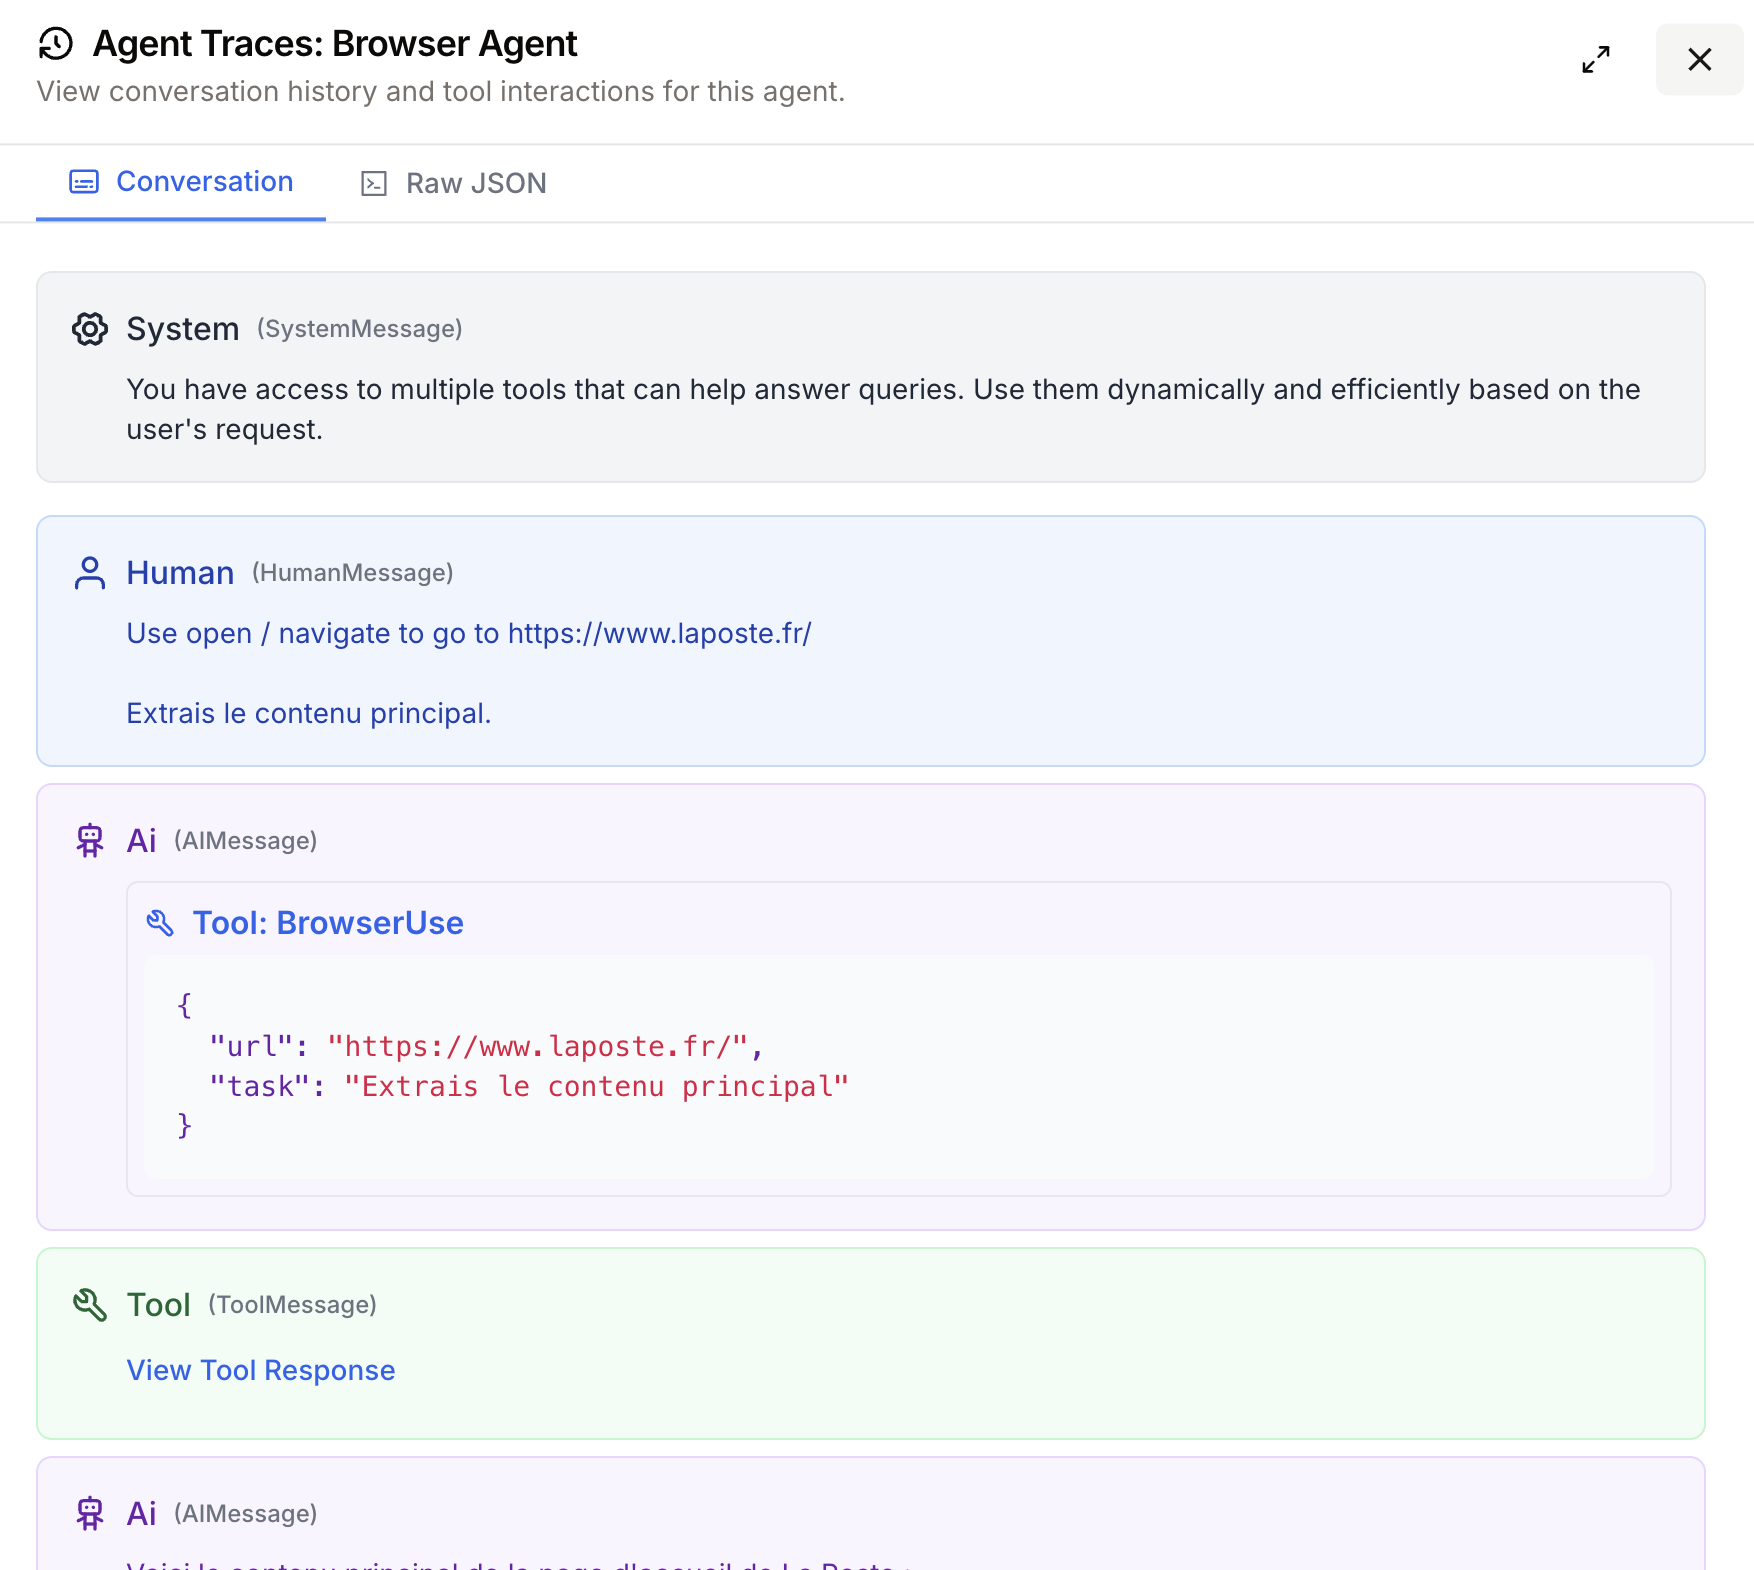
The trace includes:
| Message Type | Description |
|---|---|
| System | The initial instructions given to the agent |
| Human | The task or prompt your workflow sent |
| AI | The agent’s reasoning and tool calls |
| Tool | Results returned by tools the agent used |
Switch between Conversation view for a readable format and Raw JSON for the complete technical data.
Common agent debugging scenarios
Agent uses wrong tool
Check: Review the System message - are instructions clear?
Solution: Refine your agent prompt to be more specific about when to use each tool.
Agent loops indefinitely
Check: Look for repeated tool calls with same parameters.
Solution: Add clearer success criteria or a maximum iteration limit in your prompt.
Agent returns incomplete results
Check: Examine the Tool responses - did they return expected data?
Solution: Verify tool configurations and test tools independently.
Error handling
Built-in error handling
Configure how your node handles failures:
Workflow settings → Error Handling
| Option | Behavior |
|---|---|
| Stop on error | Halt workflow immediately |
| Continue on error | Skip failed node, continue |
| Retry | Attempt failed node again |
Using the Fail node
Gracefully handle expected errors:
- Add a Conditional node to check for problems
- Route to a Fail node with a clear message
- The workflow stops with your custom error
If {{response.status}} != 200
  → Fail: "API returned error: {{response.error}}"
Performance optimization
Identify bottlenecks
After running, check execution times:
- Look at the duration for each node
- Find the slowest nodes
- Optimize or parallelize them
Parallel execution
Run independent operations simultaneously:
        ┌→ Scrape Site A →┐
Input →│                   │→ Merge → Output
        └→ Scrape Site B →┘
Instead of:
Input → Scrape Site A → Scrape Site B → OutputCaching strategies
Reduce redundant API calls:
- Use Google Sheets as a cache layer
- Check if data exists before fetching
- Set appropriate cache TTLs
Batch processing
Process large datasets efficiently:
- Use the Loop node with batch settings
- Set reasonable batch sizes (10-50 items)
- Add delays between batches for rate limits
Execution history
Viewing past runs
Access the execution history:
- Go to Workflows in the main menu
- Click on your workflow
- Select the Runs tab
See:
- Run date and time
- Duration
- Status (success/failure)
- Input values used
Re-running workflows
To repeat a previous execution:
- Find the run in history
- Click Run again
- Optionally modify inputs
- Execute
Exporting results
Download execution data:
- Click on a completed run
- Select Export
- Choose format (JSON, CSV)
Scheduled execution
Setting up schedules
Run workflows automatically:
- Open workflow settings
- Go to Schedule
- Choose frequency:
| Schedule | Example |
|---|---|
| Hourly | Every hour at :00 |
| Daily | Every day at 9:00 AM |
| Weekly | Every Monday at 8:00 AM |
| Custom | Cron expression |
Cron expressions
For advanced scheduling:
┌───────────── minute (0-59)
│ ┌───────────── hour (0-23)
│ │ ┌───────────── day of month (1-31)
│ │ │ ┌───────────── month (1-12)
│ │ │ │ ┌───────────── day of week (0-6)
│ │ │ │ │
* * * * *
Examples:
0 9 * * 1- Every Monday at 9:00 AM0 */6 * * *- Every 6 hours30 8 1 * *- 1st of each month at 8:30 AM
Monitoring scheduled runs
Check scheduled execution status:
- View upcoming runs in the Schedule tab
- Get notifications on failures
- Review execution history